Bring your data to life with D365 Reporting
Dynamics 365 is a great tool for storing your business data, but if that is all you are using D365 for, then do we have news for you! One of the biggest values of D365 is the ability to create reports gaining valuable insight from your data. These reports can be setup in a variety of ways depending on your environment and organizational needs.
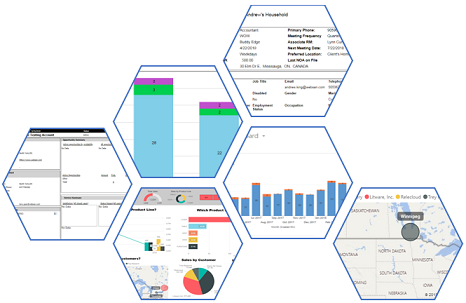
Do any of the above diagrams look familiar to you? If your response is “WHAT ARE THOSE!?” then you, my friend, are missing out! All the above are reports based on D365 data. These D365 reports can be run directly from D365 which gives users ease of access to analysis of business data. There are several types of reporting options available for D365, some are out of the box, while others require a bit more work to setup. With that in mind, many organizations opt to export their data to Excel and then use Excel to create reports, when they could be using these much richer options instead.
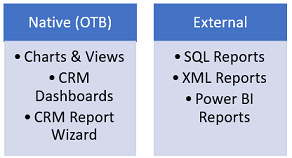
D365 out of the box comes with report building functionality, in the form of Charts and Views. Users can setup Dashboards incorporating these components, which can help them take their first step into the world of reporting. The CRM Report Wizard allows users to build reports using filters and conditions, like Views, with a touch more functionality and flexibility over the latter options.
While these out of box options are great, they do have their limitations which is why we also provide external reporting options. SQL and XML Reports are great for generating more complex reports and documents. However, if you are looking for an option that is more robust, and intensely eye-catching, then Power BI is the way to go. Power BI is one the most powerful BI and reporting tools on the market and integrates seamlessly with D365. Power BI allows for powerful drill down capability and smart slicers to filter your data however you like.
Reports are a great way for organizations to better understand performance, and with the various report options available, you are not limited to a specific visualization type. Data can be displayed through bar graphs, pie charts, map representations, grids…just to name a few! Maximizing the reporting options is great for upper management, who want a quick, high-level representation of how the business is doing. But wait there’s more! Automated reports can be generated with a click of a button and often require no additional maintenance once they are setup, reducing time and effort and improving efficiencies.
D365 reports can be made for all aspects of the business from financials and sales to marketing and service. With all these options at your disposal, why not try out reports for your business today. Talk with your team and find out the key metrics that matter to them, then contact us at