Introduction to Power BI: What is Power BI?
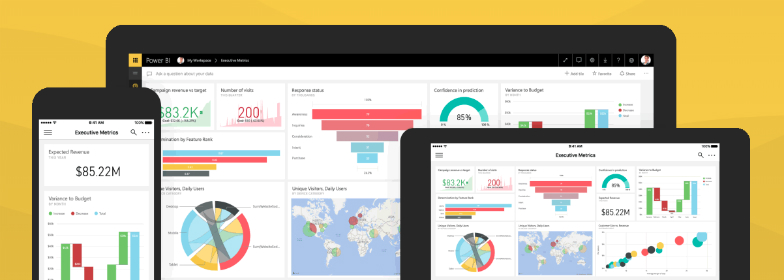
Microsoft Power BI can help company owners take a closer look into their business using stunning dashboards and visuals. They can also be optimized to locate and display only the most critical data. This data can then be used by company owners to review and streamline their business processes wherever it may be needed.
There are a large variety of data sources that connect to Power BI, and the list is continuously being updated. This data can then be altered and placed as a visual, measured or calculated column and then is added to a dashboard. It’s possible to share this information with colleagues at work by granting them access right from within Power BI.
These are six main components that make Power BI into such a strong and powerful tool.
Power Query: Importing and formatting the Data
The Power Query allows you to import data from sources such as SQL Server, Oracle, MySQL, DB2, and the list goes on. It can also extract data from multiple file formats such as CSV, Text, and Excel. The imported data can be formatted by adding columns, charts or any other visuals onto the dashboard.
Power Pivot: Relationship Creating Tool
Relationships can be created using the Power Pivot function inside Power BI. Power Pivot is a powerful tool used to review data and create visual data models. To link tables together, Power Pivot can analyze the databases and see if the tables have any matching data inside. This function also allows the user to create calculations using the data, such as a calculated column or a measurement.
Power View: Data Visualization Tool
Power View is used to transform the data into interactive charts, graphs, maps, and other visuals. These visuals will only display the most important data since the data can be filtered using Filter Panes, slicers, and cross-filters.
Power Map: 3D Geospatial tool
The Power Map feature is used to create charts for Geospatial data into a 3D visual. Using the Geospatial users can display a metric visually on a map using visuals or even a heatmap. The maps are connected to Bing and are constantly refreshing to display real-time data.
Power Q&A: Answering and Question search engine
Users can ask the Q&A any questions regarding the data and get the quickest answers. Make sure to use natural language that the system would understand such as “Number of Products by Location.” Click Here for a list of words and terminology that Power BI Q&A recognizes.
Microsoft Power BI has six main components that make it such a powerful tool. It has become one of the most popular programs amongst small business owners to analyze their data. Watch this “Power BI 101 Webinar” video that goes beyond just the fundamentals of Power BI. This video will demonstrate how to create a dashboard using Power BI.