Mastering Manufacturing with Business Central: Reporting and Analytics for Capacity Planning
Introduction
In manufacturing, real-time visibility into production capacity is crucial for decision-making and optimizing workflow. Microsoft Dynamics 365 Business Central empowers manufacturers with powerful reporting and analytics tools to track production loads, identify bottlenecks, and make informed adjustments. With the right insights, manufacturers can fine-tune their operations to boost efficiency, reduce costs, and improve overall throughput.
In this blog, we'll explore how Business Central's reporting tools enhance capacity planning, provide real-time visibility into work center loads, and support long-term strategic planning.
The Power of Capacity Reporting in Business Central
Capacity reporting in Business Central allows manufacturers to visualize the current and future workloads across all work centers and machine centers. This level of insight helps identify bottlenecks, underutilized resources, and opportunities to optimize scheduling.
One of the primary tools for this is the Work Center Load Report, which provides a graphical representation of capacity consumption over time. In the video demonstration, the report showcases the allocated capacity for each work center, broken down by day and week.
The report also allows users to drill down into specific work centers, view the production orders occupying capacity, and make adjustments as necessary. This real-time visibility helps manufacturers make proactive changes before bottlenecks disrupt production.
Capacity Utilization and Optimization
Beyond simple load reporting, Business Central also provides insight into Capacity Utilization. This report measures the percentage of capacity that is currently being utilized versus what is available. For manufacturers running multiple shifts or operating with tight margins, understanding this metric is crucial.
In the video, the Capacity Utilization Report is demonstrated, showing how manufacturers can track the efficiency of their work centers.
For example, if a work center is consistently running at 70% capacity, it may indicate an opportunity to take on more production or streamline operations. Conversely, if it's operating above 100%, it may signal an overload, which could lead to delays and quality issues.
Identifying Bottlenecks and Overloads
One of the most valuable aspects of Business Central's reporting capabilities is its ability to pinpoint bottlenecks. Bottlenecks occur when work centers are overloaded, leading to delays and production inefficiencies.
The Load Report helps manufacturers identify these trouble spots by highlighting work centers that are running at or above their maximum capacity.
By visualizing these overloads, manufacturers can make data-driven decisions to:
- Redistribute workloads to less busy work centers.
- Adjust production schedules to balance capacity.
- Evaluate whether additional resources are necessary.
Addressing bottlenecks before they escalate prevents costly downtime and keeps production running smoothly.
Leveraging Power BI for Advanced Analytics
While Business Central offers robust native reporting, integrating with Power BI allows manufacturers to take their analytics even further. Power BI connects directly with Business Central, providing interactive dashboards and advanced data visualization.
In the video demonstration, a Power BI dashboard is shown that displays capacity utilization across all work centers, with drill-down capabilities for deeper insights.
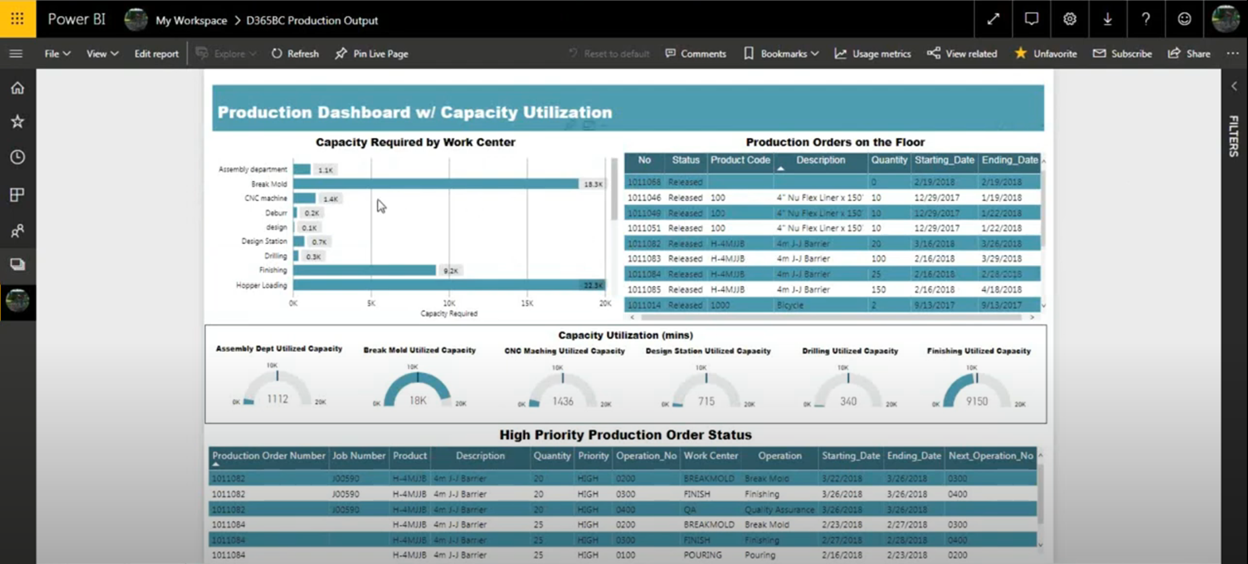
With Power BI, manufacturers can:
- Visualize long-term capacity trends.
- Identify seasonal fluctuations in production.
- Create predictive models to anticipate capacity shortages.
This integration allows for enhanced decision-making, helping manufacturers optimize production schedules based on real-time data and historical trends.
Strategic Planning with Capacity Analytics
The insights gained from capacity analytics go beyond day-to-day operations—they support long-term strategic planning. By understanding how capacity is utilized over time, manufacturers can make informed decisions about expanding production, adding new work centers, or adjusting shifts.
For example, if a manufacturer consistently sees overloads in a particular work center, it may justify the purchase of additional machinery or the hiring of more staff. Conversely, if certain machine centers are underutilized, it may highlight opportunities for cost-saving adjustments.
These data-driven decisions contribute to leaner operations, optimized resource allocation, and stronger profit margins.
Watch the Full Webinar
If you want to see this in action, watch our full webinar:
Microsoft Dynamics 365 Business Central Manufacturing Series Part V: Capacity Planning
Contact Us to Learn More
Ready to optimize your manufacturing operations with Business Central? Contact WebSan Solutions to learn how we can help you implement capacity planning and streamline your production processes.